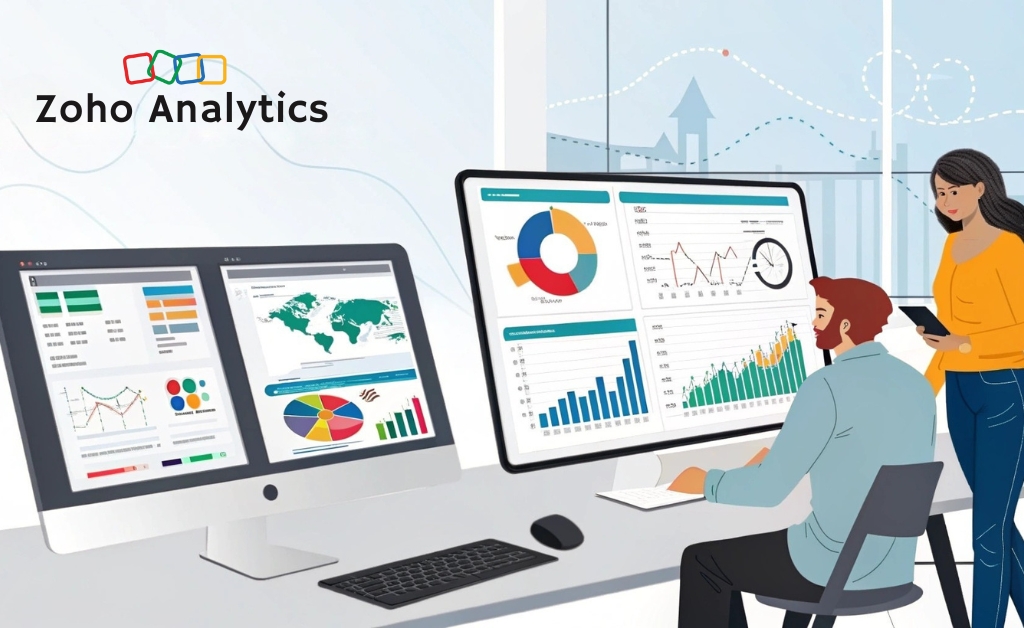
Still jugling outdated spreadsheets or clunky dashboards? Discover how Zoho Analytics lets you build fully automated project management dashboards in minutes with real-time data sync, AIgenerated insights and customizable reports, this tool does the heavy lifting so you can focus on strategy, not manual updates ready to transform how you track and report your projects ? let’s dive in.
Dashboards that build themselves (Almost)
We’ve all spent way too much time tinkering with charts, filtering data and trying to build the perfect project dashboard what if your dashboard could build itselfand get smarter as your project evolved? That’s exactly what Zoho Analytics brings to the table.
This AI-powered platform doesn’t just visualize data it interprets it, learns from it and presents it in ways that drive real decisions, especially for teams actively seeking ways to track progress and spot risks in real time without drowning in spreadsheets.
Connect your data once, see everything forever
One of the most powerful features in Zoho Analytics is its data integration capabilities, you can pull information from:
- Project management platforms (like Trello – Asana – ClickUp – Monday.com)
- Time tracking tools (like Harvest or Clockify)
- CRM systems (like Zoho CRM or Salesforce)
- Spreadsheets – cloud storage – SQL databases – APIs you name it
Once connected, data flows into Zoho Analytics continuously it’s not just importing it’s syncing in real time, so if a task is marked completed in Asana, your dashboard reflects that change instantly
Expert insight: According to a Stanford research brief, realtime analytics systems improve response time to project risks by 35% compared to static reports
Drag – drop – done: Building your first dashboard
You don’t need to be a data scientist to use Zoho Analytics, creating dashboards is as easy as dragging widgets onto the canvas, the AI suggests visualizations based on your data type and even offers template layouts for common use cases like:
- Project Health Overview: Task progress- overdue items- team workloads
- Milestone Tracking: Forecast vs actual completion dates
- Resource Utilization: Time allocation, bottlenecks and team efficiency
You can also customize color coding, filters, chart types and access controlswant a stakeholder-only view that hides internal notes? Done in a few clicks.
Example: Agile sprint dashboard layout
| Section | Widget | Purpose |
|---|---|---|
| Sprint progress | Burndown chart | visualize remaining work vs time |
| Team velocity | Bar graph | compare completed story points per sprint |
| Issue tracker | Pie chart | breakdown of open vs. resolved issues |
Ask your dashboard anything (literally)
Here’s where Zoho Analytics gets truly futuristic its natural language query feature you can type plain-English questions like:
- “Show me tasks that are more than 3 days overdue”
- “Which team member has completed the most high-priority items this month?”
- “What’s the average time to resolve bugs?”
The AI instantly returns charts, KPIs or tables – no formulas – no filters – no SQL this is perfect for managers, clients or stakeholders who don’t want to click through dashboards or learn the backend of analytics tools.
Key Insight: Zoho’s AI assistant Zia understands context, so even follow-up questions like “break that down by department” yield meaningful results
Predict Delays Before They Happen
Zoho Analytics doesn’t stop at showing you what’s happening it tells you what’s about to happen using historical trends and machine learning, the platform can forecast delays, resource gaps and budget overruns before they impact your timeline.
Types of AI-Generated Forecasts:
- Timeline Projections: Estimate future milestone completion based on current pace
- Workload Trends: Spot rising workloads that may lead to burnout or delays
- Performance Deviation: Get alerts when task completion rates fall below average
This is ideal for Agile teams looking to track sprint velocity, project-based businesses monitoring delivery times or any team that relies on timely execution- especially those beginning to embrace broader AI strategies to revolutionize how they manage projects from the ground up.
Automated reports you’ll actually use
Reporting is usually a weekly chore with Zoho Analytics, it becomes a 1-click operation, you can schedule automated reports to be emailed to team members, managers or clients on a daily, weekly or custom basis.
Want a Monday morning executive summary showing the top risks and current progress? Set it once and forget it
- PDF and Excel exports available
- Interactive links to dashboards included
- Role-based views for different stakeholders
Is Zoho analytics the right fit for your team?
If you’re running a project-driven team with more than a few moving parts, chances are Zoho Analytics will pay for itself fast, it’s particularly useful for:
- Project managers looking to replace spreadsheets with live insights
- Team leads managing multiple workstreams and dependencies
- Operations professionals who need high-level oversight and micro-level control
Zoho Analytics takes the guesswork out of project management with AI-powered dashboards that work in real time from tracking KPIs to forecasting delays, everything stays up-to-date automatically if you want smarter, faster and fully automated reporting, Zoho is your next project co-pilot try it out and elevate your project tracking game with real-time insights today.